Upload Data Attribution VS Dashboard Data Attribution
You may notice that the data on your client dashboard does not match the information shown on the Upload Overview Report. This can include Total Revenue/Purchases, New Revenue/Purchases, or Repeat Revenue/Purchases. Usually this is caused by either incorrect settings for the client dashboard in the admin panel, or the way extrapolation is calculated.
Expected Revenue Formula
The formula for expected revenue is:
Expected Revenue = New Purchases * (Yearly Value - First Initial Purchase)
Example:
Total New Purchases = 456
Yearly Value = $124.89
First Initial Purchase = $37
Step 1. 456 * ($124.89 - 37)
Step 2. 456 * $87.89 = $40,077.84
Dashboard Total Revenue Doesn't Match Upload Overview Report
If you believe your Expected Revenue is incorrect, please make sure that your Yearly Value of a customer and the First Initial Purchase are set correctly in the admin panel of the client dashboard.
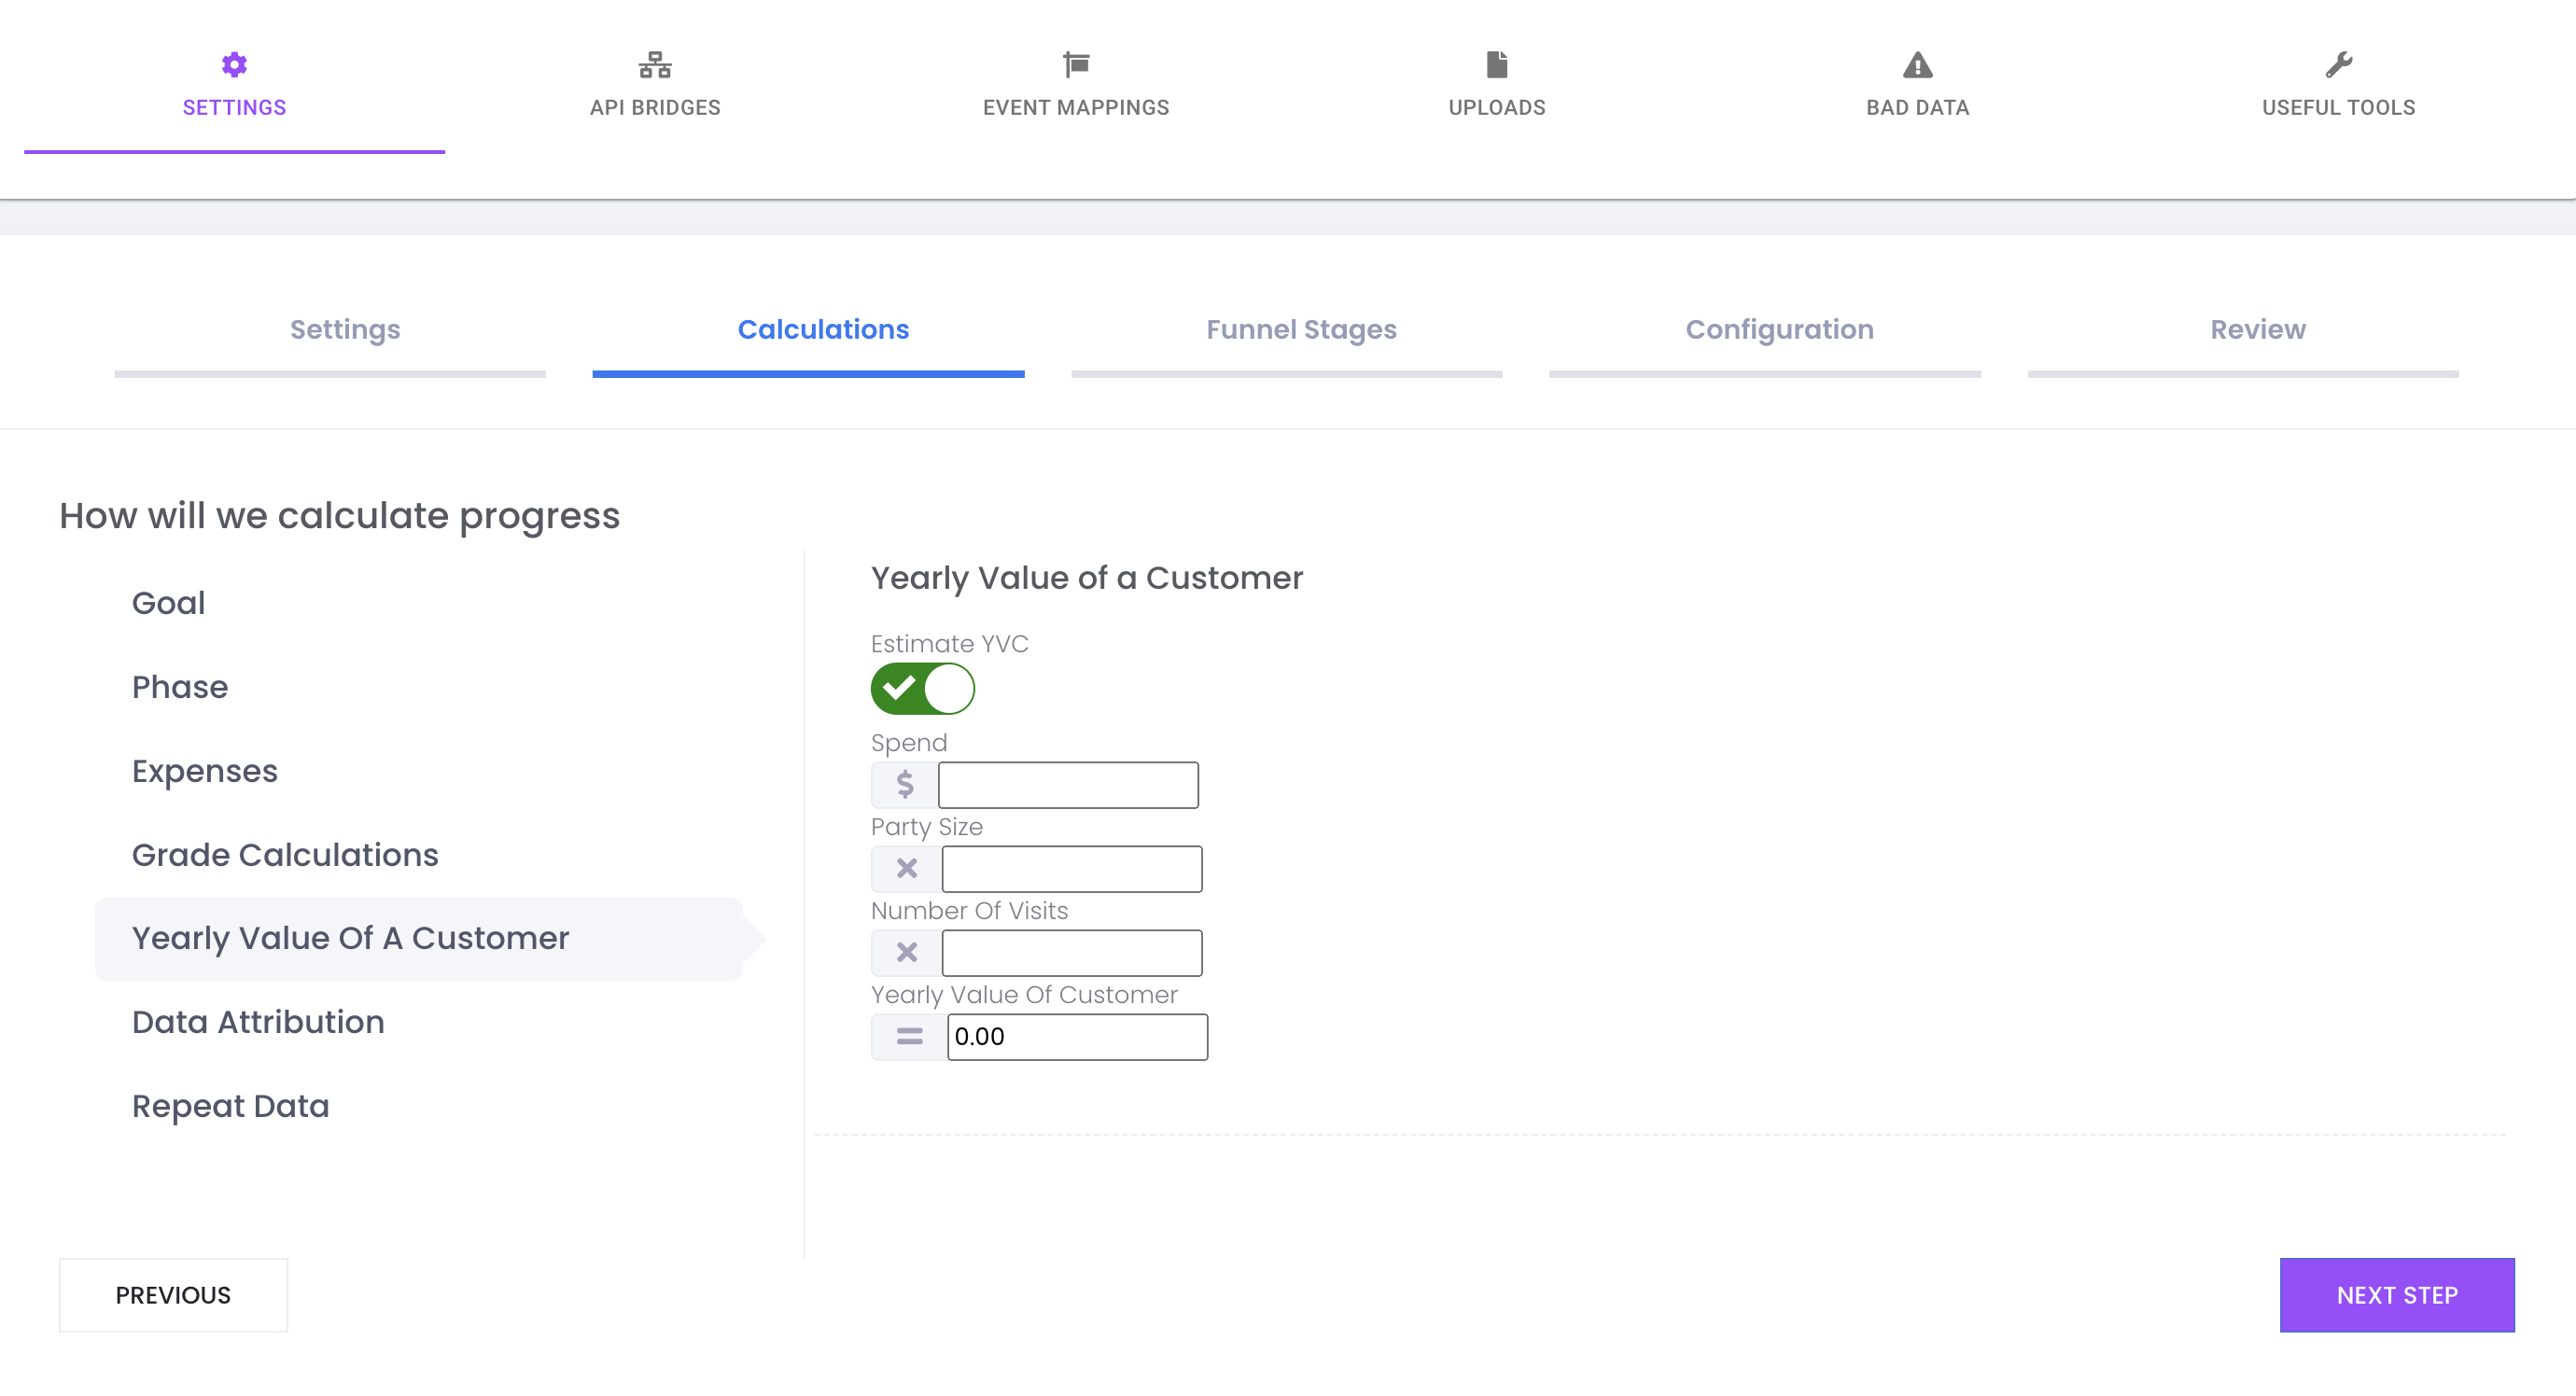
Yearly Value of a Customer
can be found in the Admin Panel for your Client Dashboard under Settings>Calculations>Yearly Value of A Customer
First Initial Purchase
can be found in the Admin Panel for your Client Dashboard under Settings>Calculations>Expenses
Dashboard Total KPI Doesn't Match Upload Overview Report
If your Yearly Value of a Customer and your First Initial Purchase amount are set correctly, and you feel that your expected revenue still doesn't match, check to see if your number of new purchases is different than expected. This can be caused by Data Extrapolation.
Match Rate, Attribution, and Extrapolation
Marketing Milk can extrapolate data from the data that it is given. This is an effort to compensate for a client who may not be able to gather all of the customer data related to their purchases.
For example, if a client can only collect 50% of their customer data, that doesn't mean that the ad copy or creative images were 50% worse than a previous sprint. It simply means the client wasn't able to collect it all of the data needed to be able to match their purchases to our marketing campaigns.
In able to extrapolate the data, we need two things.
1. Match Rate
2. Attribution.
Match Rate
Match rate is number of sets of data points (First Name, Last Name, Email, Phone Number, City, State, Zip, Value, Event Date) that can be matched to an existing Facebook Profile.
For example, if you have 100 sets of data points, and are able to match 65 of those sets to an existing Facebook Profile, you would have a 65% match rate. This doesn't necessarily mean that only 65 of those 100 data sets have a Facebook profile. It's possible that the match rate could be higher if the data provided to Facebook was better. For example, in the dataset below, Facebook is more likely to find a match for the second data set because it includes more information.
fn,       ln,       email,               phone,           value
John,   Smith,                    ,   123-456-7890,      $25.00
Jane,   Smith,    jsmith@gmail.com,   789-540-1265,      $40.00
Attribution
Now that you understand match rate, it’s time to talk about attribution. In the example above, of the 65 data sets who matched to a Facebook user profile, Facebook can tell us how many of those Facebook profiles were served an ad from Drive. If someone saw one of our ads and made a purchase, that means they are attributed to our ad campaigns for the client.
Extrapolation
Let's say you have an upload with 100 events. Of those 100 events successfully uploaded to Facebook, 70 of them are new and 30 are repeat. Then let's say the match rate for that upload (i.e. the percentage of events Facebook could tie to a valid user) is %70. In addition, we know from Facebook insights that 35 new and 15 repeat of the uploaded events are guaranteed to be attributed to Drive. With all this information we can estimate (i.e. extrapolate) how many more users would attribute to your ad campaigns if your match rate was 100% instead of 70% due to not being able to collect 100% of the customer information.
We calculate the extrapolation for New and Repeat separately and then aggregate them together. The calculation is done as follows:
(NOTE: the example below is based off the NEW conversion data above. It would also be done with REPEAT conversion data as well.)

Extrapolation Calculation:
matched = totalConversions * matchRate = 70 * .70 = 49
unmatched = totalConversions - matched = 70 - 49 = 21
attributionRate = attributedConversions / matched = 35 / 49 = 0.71428571428
extrapolatedConversions = unmatched * attributionRate = 21 * 0.71428571428 = 14.9999999999
NOTE: We then floor the results. So the final extrapolated number will be the following:
Total Extrapolation Conversions = 14
Questions
Why is the number of attributed purchases on my dashboard different than the number of attributed purchases on my upload overview report?
The data on an upload overview report only represents the match and attribution rate as it relates to the data that was uploaded.
The attributed purchases on your clients dashboard uses a global match rate of all data that has been uploaded for that client. By using this wider range of data changes the values that are used to calculate extrapolated data. If fewer purchases are attributed, less revenue can also be attributed.
This does not mean that either number is wrong, it is just being looked at through a different scope.
Related Articles
Extrapolation Calculation
Market Milk Upload Process The anatomy of an upload as it is processed by Marketing Milk and then Facebook. Upload to Marketing Milk Let's say you upload 100 events to Marketing Milk. Before sending these events to Facebook we first process the ...Bad Data
What is Bad Data? Bad data is any data with errors that has been uploaded to Facebook or Marketing Milk. Uploads can fail for a various number of reasons, and once uploaded event data reaches Facebook, it is not possible to remove or modify that data ...Extrapolation at the Campaign/Adset/Ad Level
Extrapolation at the Campaign/Adset/Ad Level Overview It might be noticed when perusing the Metrics table on the dashboard that Totals may not exactly line up on the Main Account-level dashboard as they might at the Campaign level. This issue ...Release Notes 5/13/22
Google Analytics The code powering the Google Analytics metrics page has been migrated from legacy PHP to Typescript to enable Marketing Milk to keep up with future improvements. For example, in summer 2023, Google will be sunsetting the current ...Release Notes 9/26/2022
Competition Finder Competition Finder is a new feature in Marketing Milk Ad Builder. The purpose of this feature is to give users and businesses insight into their competition so they can build more effective audiences. When Competition Finder is ...